User login
News
osc2xrd
 osc2xrd: software for processing the X-ray powder diffraction data obtained from the curved image plate detector of Rigaku RAXIS Rapid II diffractometer
You can use osc2xrd for transformation of primary diffraction 3D (X–Z–I) data obtained on diffractometers with a cylindrical detector Rigaku RAXIS Rapid II and DMAX (*.osc files) into standard X-ray 2D 2Θ–I profiles (*.xrd files) suitable for full-profile analysis by the Rietveld method.
Data processing is divided into three main constituents:
- translation of sensor coordinates X–Z into 2Θ angles,
- correction of intesity drop along the vertical Z-axis of the sensor,
- selection of areas for their processing.

Translation of coordinates is performed using the formula describing intersection of cone and cylindre:
$$\large 2\mit\Theta=\arccos\Big(\cos\frac{|X-X_B|}{D}\times\cos\Big(\arctan\frac{|Z-Z_B|}{D}\Big)\Big),$$
where X and Z – horizontal and vertical coordinates of the sensor, XB and ZB – coordinates of the direct beam center, D – shortest sample-sensor distance (127.4 mm). 2Θ values (in degrees and hundredths of degrees) are multiplied by 100 and converted into integers for convenient and fast data manipulation (as 2Θ values are used for indexation of intensity data).
Vertical intensity correction includes three main affecting factors: the quadratic attenuation of light with increasing distance from the sample to the horizontal row of pixels on the sensor, the dependence of the illumination on the angle of incidence and on the absorption of x-rays in air, which has a significant impact even at small distances of the order of several centimeters (particularly when using CoKα radiation with low energy photons). Moreover, there are additional correction factor for the intensities cos(Θ) and user-specified constant scaling factor. The quality of correction along the Z-axis can be checked by constructing vertical profiles of intensities for specified narrow ranges of values 2Θ in the intervals of the x-ray profile which are not complicated by reflections (intensity peaks).
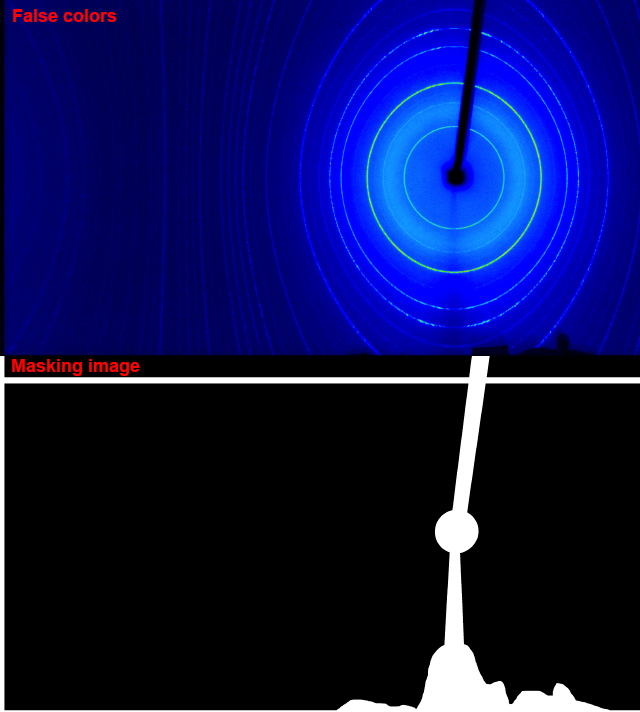
Areas for processing can be set by specifying the 2Θ ranges and X–Z-coordinates of interest, and by masking the areas to be excluded (mainly the shadows from the beamstopper and other hardware elements). Raster images in false colors are used for this purpose: they must be created using this program and edited in any raster graphics editor.
The calculation of the average intensities is performed for each 2Θ value in increments of 0.01°. Sensor matrix resolution (10 px/mm) is insufficient for this step in a very narrow range of angles 2Θ ≈ 90° (where the elliptical isograd degenerates into a straight line): it is manifested by the absence of data for individual 2Θ values in the table and sawlike interference patterns on diagrams. These gaps are filled using linear interpolation. Smoothing of intensities is done by calculating the moving averages in the 2Θ window of the specified width. In addition, you can increase the step along the 2Θ axis up to 0.02° to achieve even more smoothed profile.
Diffractograms computed by the program are shown on the chart for their primary examination and comparison. If necessary, the data from the osc-file can also be saved to a TAB-delimited table as an ASCII plain text file.
The program is written in close cooperation with Sergey N. Britvin (St.-Petersburg State University, Institute of Earth Sciences, Department of Crystallography).
Bibliographic reference:
Russian:
Britvin S.N., Dolivo-Dobrovolsky D.V., Krzhizhanovskaya M.G. Software for processing the X-ray powder diffraction data obtained from the curved image plate detector of Rigaku RAXIS Rapid II diffractometer // Proceedings of the Russian Mineralogical Society, 2017, v. 146, No 3, p. 104-107. Article on eLibrary.ru
(Бритвин С.Н., Доливо-Добровольский Д.В., Кржижановская М.Г. Программный пакет для обработки рентгеновских порошковых данных, полученных с цилиндрического детектора дифрактометра Rigaku RAXIS RAPID II // Записки РМО, 2017, ч. CXLVI, №3, с. 104-107)
If you like these programs and want to support their development, you can make a donation here
Comments
Program update
The program has been updated. List of changes and new features in v.1.1: